Technical Analysis of KRUS 2024-05-31
Overview:
In analyzing the technical indicators for KRUS over the last 5 days, we will delve into the trend, momentum, volatility, and volume indicators to provide a comprehensive outlook on the possible stock price movement in the coming days. By examining these key indicators, we aim to offer valuable insights and recommendations for potential investors.
Trend Analysis:
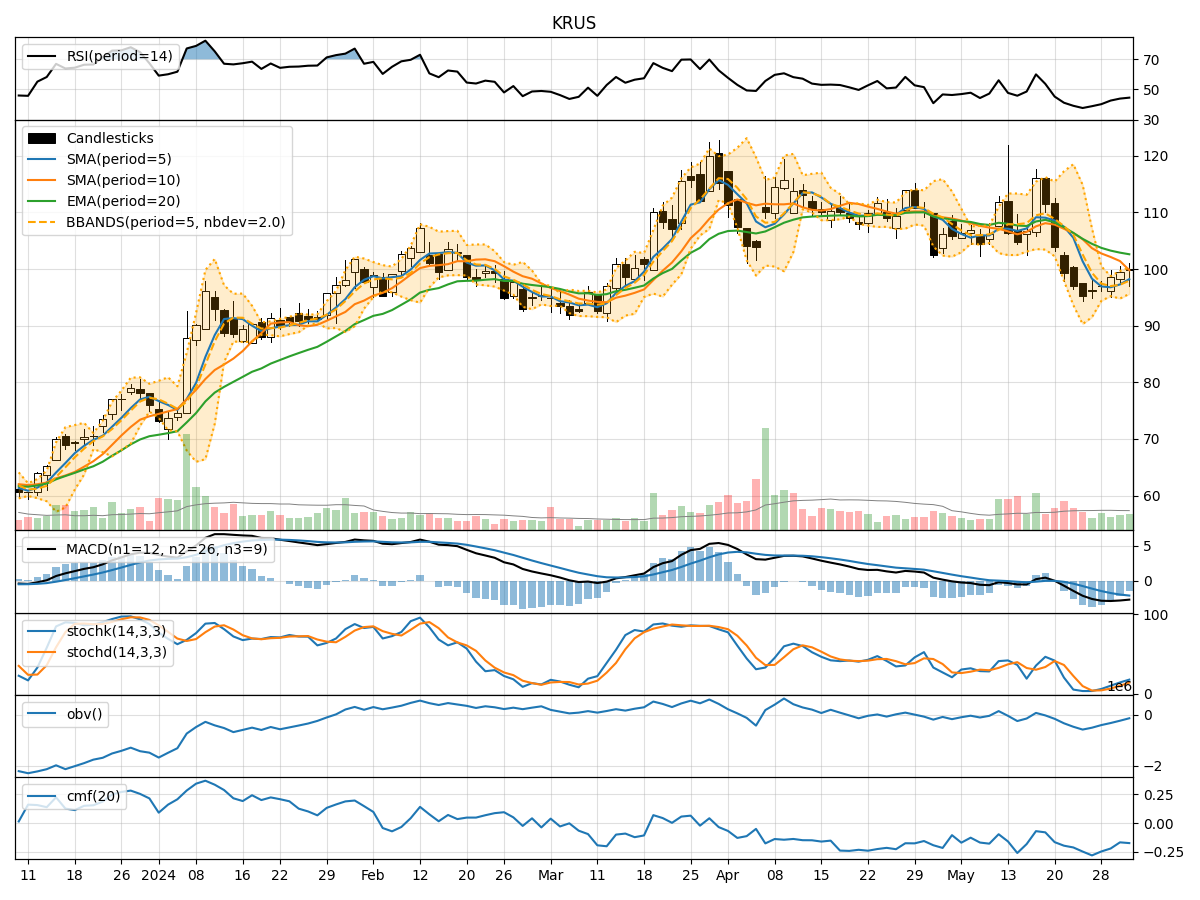
- Moving Averages (MA): The 5-day moving average (MA) has been consistently below the simple moving average (SMA) and exponential moving average (EMA) over the past 5 days, indicating a downtrend in the stock price.
- MACD: The MACD line has been below the signal line, with the MACD histogram showing a decreasing trend, suggesting bearish momentum in the stock.
Momentum Analysis:
- RSI: The Relative Strength Index (RSI) has been gradually increasing but remains below the overbought threshold of 70, indicating neutral to slightly bullish momentum.
- Stochastic Oscillator: Both %K and %D lines of the Stochastic Oscillator have been rising, signaling positive momentum in the stock price.
Volatility Analysis:
- Bollinger Bands (BB): The stock price has been trading within the Bollinger Bands, with the bands narrowing, suggesting reduced volatility in the stock.
- Bollinger %B: The %B indicator has been hovering around 0.5, indicating the stock is trading at the middle of the bands.
Volume Analysis:
- On-Balance Volume (OBV): The OBV has been declining over the past 5 days, indicating selling pressure in the stock.
- Chaikin Money Flow (CMF): The CMF has been negative, suggesting outflow of money from the stock.
Conclusion:
Based on the analysis of the technical indicators, the stock of KRUS is currently exhibiting a bearish bias in the short term. The trend indicators, such as moving averages and MACD, point towards a continued downtrend. However, momentum indicators like RSI and Stochastic Oscillator show some signs of potential upside momentum.
Considering the volatility is decreasing and the stock is trading within the Bollinger Bands, we may see the stock price consolidate in the near future. The declining OBV and negative CMF indicate a lack of strong buying interest and potential further downside pressure.
Therefore, the next few days' possible stock price movement for KRUS is likely to be sideways with a bearish bias, with the potential for some short-term upside momentum. Investors should closely monitor key support and resistance levels for potential entry or exit points in their trading strategies.