Technical Analysis of LQDA 2024-05-31
Overview:
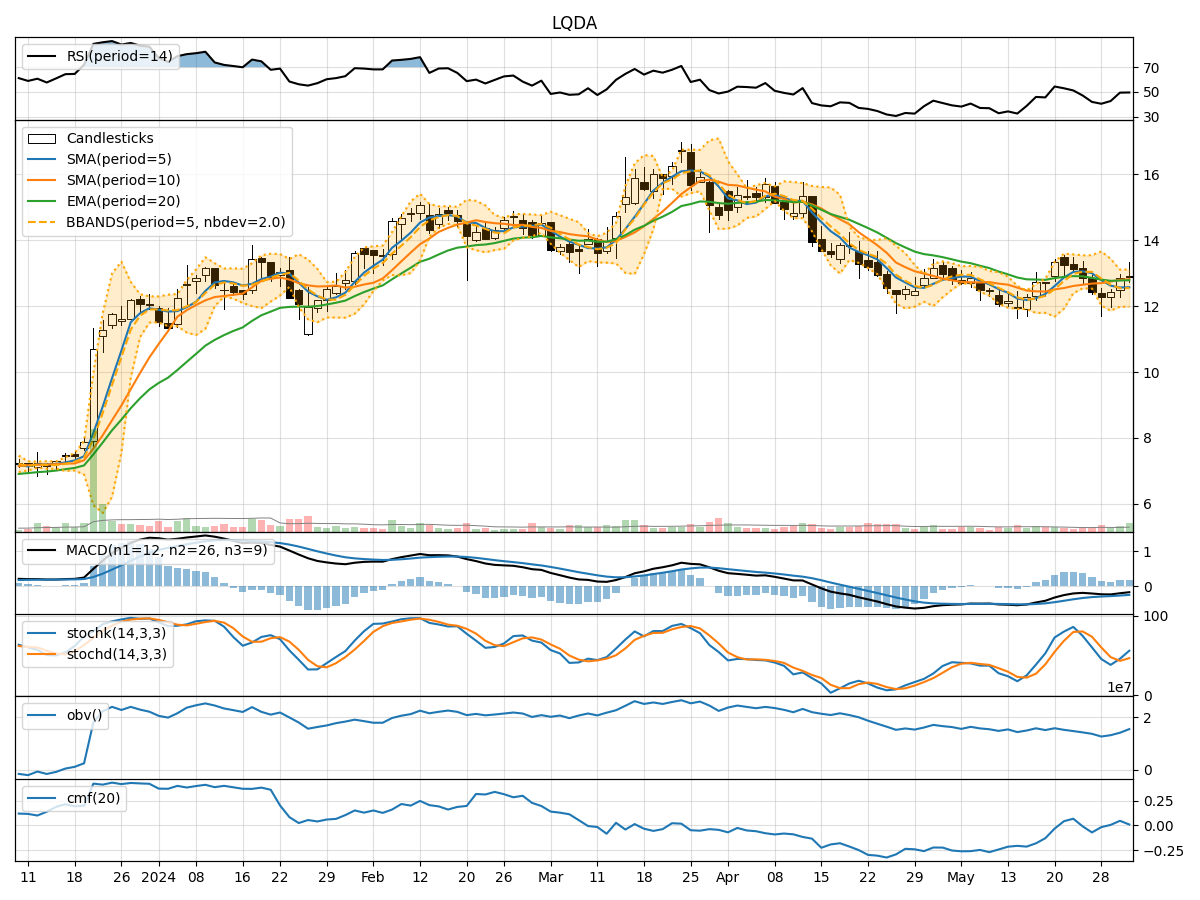
In analyzing the technical indicators for LQDA over the last 5 days, we will delve into the trend, momentum, volatility, and volume indicators to provide a comprehensive outlook on the possible stock price movement in the coming days. By examining these key aspects, we aim to offer valuable insights and predictions for informed decision-making.
Trend Analysis:
- Moving Averages (MA): The 5-day MA has been consistently below the closing prices, indicating a short-term downtrend.
- MACD: The MACD line has been negative, suggesting a bearish momentum in the stock.
- EMA: The EMA has been declining, reflecting a weakening trend.
Key Observation: The trend indicators point towards a bearish sentiment in the stock price movement.
Momentum Analysis:
- RSI: The RSI values have been fluctuating around the mid-level, indicating a lack of strong momentum.
- Stochastic Oscillator: Both %K and %D have been relatively low, signaling a potential oversold condition.
- Williams %R: The Williams %R values have been hovering in the oversold territory.
Key Observation: Momentum indicators suggest a neutral to slightly bearish momentum in the stock.
Volatility Analysis:
- Bollinger Bands (BB): The stock price has been trading within the lower Bollinger Band, indicating lower volatility.
- Bollinger %B: The %B values have been below 0.2, suggesting a potential oversold condition.
Key Observation: Volatility indicators point towards a low volatility environment in the stock.
Volume Analysis:
- On-Balance Volume (OBV): The OBV values have been declining, indicating selling pressure in the stock.
- Chaikin Money Flow (CMF): The CMF has been negative, reflecting a bearish money flow trend.
Key Observation: Volume indicators highlight increased selling pressure in the stock.
Conclusion:
Based on the analysis of trend, momentum, volatility, and volume indicators, the overall outlook for LQDA in the next few days appears to be bearish. The stock is likely to experience continued downward pressure, with a potential for further decline in the stock price. Traders and investors should exercise caution and consider short-term strategies to navigate the current market conditions.
Key Conclusion: The stock is expected to trend downward in the coming days, with a bearish sentiment prevailing across multiple technical indicators.