Technical Analysis of OTLK 2024-05-31
Overview:
In analyzing the technical indicators for OTLK over the last 5 days, we will delve into the trend, momentum, volatility, and volume indicators to provide a comprehensive outlook on the possible stock price movement in the coming days. By examining these key indicators, we aim to offer valuable insights and predictions for investors looking to make informed decisions.
Trend Analysis:
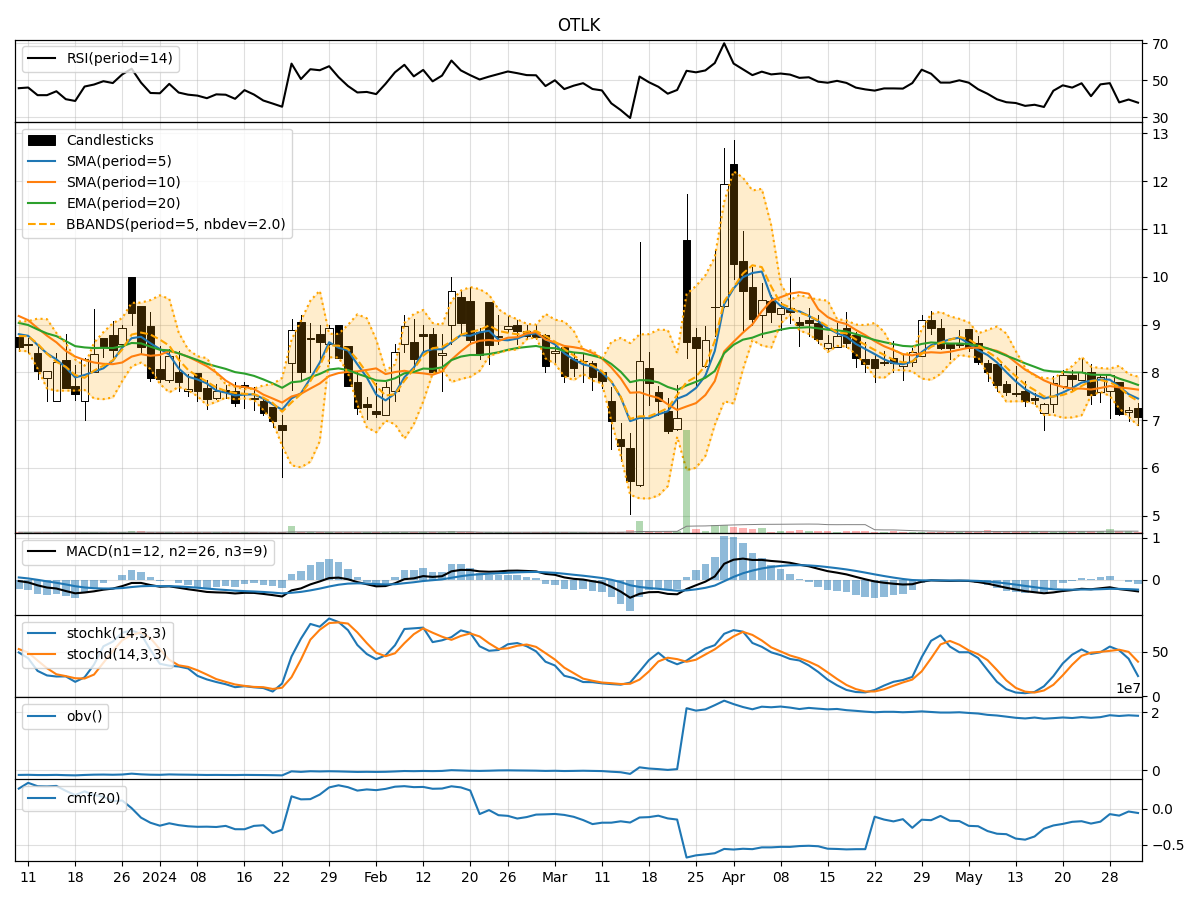
- Moving Averages (MA): The 5-day MA has been fluctuating around the closing prices, indicating a lack of clear trend direction.
- MACD: The MACD line has been consistently negative, suggesting a bearish momentum in the short term.
- RSI: The RSI values have been hovering around the mid-range, indicating a neutral sentiment among traders.
Momentum Analysis:
- Stochastic Oscillator: The stochastic indicators have shown mixed signals, with some days indicating oversold conditions.
- Williams %R (WillR): The Williams %R values have been consistently in oversold territory, signaling a potential reversal.
Volatility Analysis:
- Bollinger Bands (BB): The Bollinger Bands have been narrowing, indicating decreasing volatility and a possible period of consolidation.
- Average True Range (ATR): The ATR values have been relatively stable, suggesting a lack of significant price movements.
Volume Analysis:
- On-Balance Volume (OBV): The OBV has been fluctuating, reflecting indecision among market participants.
- Chaikin Money Flow (CMF): The CMF values have been negative, indicating selling pressure in the stock.
Key Observations:
- The trend indicators suggest a lack of clear direction, with a bearish bias indicated by the MACD.
- Momentum indicators show mixed signals, with potential for a reversal indicated by oversold conditions.
- Volatility indicators point towards a period of consolidation and decreased price movements.
- Volume indicators reflect indecision and selling pressure in the market.
Conclusion:
Based on the analysis of the technical indicators, the outlook for OTLK in the next few days is likely to be sideways with a bearish bias. Traders should exercise caution and wait for clearer signals before making significant trading decisions. It is advisable to monitor key levels of support and resistance for potential breakout opportunities.