Technical Analysis of PTSI 2024-05-31
Overview:
In analyzing the technical indicators for PTSI over the last 5 days, we will delve into the trend, momentum, volatility, and volume indicators to provide a comprehensive assessment of the stock's potential price movement. By examining these key factors, we aim to offer valuable insights and predictions for the next few days.
Trend Indicators:
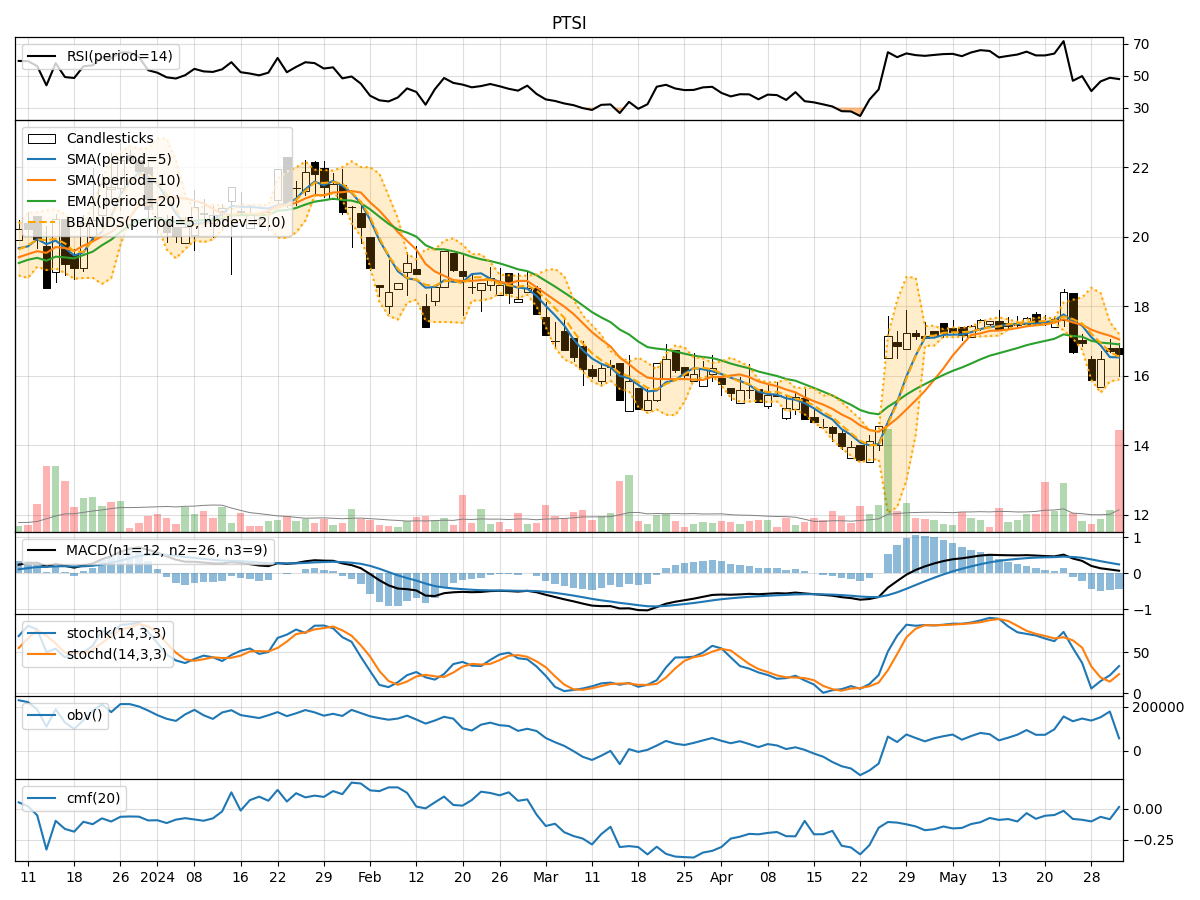
- Moving Averages (MA): The 5-day MA has been consistently below the closing prices, indicating a short-term downtrend.
- MACD: The MACD line has been above the signal line, but both are trending downwards, suggesting a weakening bullish momentum.
- EMA: The EMA has been declining, reflecting a bearish sentiment in the stock's price movement.
Key Observation: The trend indicators point towards a bearish outlook for PTSI in the short term.
Momentum Indicators:
- RSI: The RSI has been fluctuating around the 50 level, indicating a lack of strong momentum in either direction.
- Stochastic Oscillator: Both %K and %D have been relatively low, suggesting a potential oversold condition.
- Williams %R: The indicator has been hovering in the oversold territory, signaling a possible reversal.
Key Observation: Momentum indicators are showing signs of potential reversal or consolidation in the near future.
Volatility Indicators:
- Bollinger Bands: The stock price has been trading within the bands, with the %B indicator fluctuating around the midline.
- Volatility: The volatility has been relatively stable over the past few days, indicating a lack of significant price fluctuations.
Key Observation: Volatility indicators suggest a sideways or consolidation phase for PTSI in the short term.
Volume Indicators:
- On-Balance Volume (OBV): The OBV has been fluctuating, indicating indecision among market participants.
- Chaikin Money Flow (CMF): The CMF has been negative, reflecting selling pressure in the stock.
Key Observation: Volume indicators point towards a bearish sentiment prevailing in the market.
Conclusion:
Based on the analysis of trend, momentum, volatility, and volume indicators, the overall outlook for PTSI in the next few days is bearish. The trend indicators suggest a continued downtrend, while momentum indicators hint at a possible reversal or consolidation. Volatility indicators indicate a sideways movement, and volume indicators reflect selling pressure.
Therefore, the most likely scenario for PTSI in the next few days is a continuation of the bearish trend with the possibility of some consolidation or reversal in momentum. Traders and investors should exercise caution and consider risk management strategies in their decision-making process.