Technical Analysis of RETO 2024-05-31
Overview:
In analyzing the technical indicators for RETO over the last 5 days, we will delve into the trend, momentum, volatility, and volume indicators to provide a comprehensive outlook on the possible stock price movement. By examining these key aspects, we aim to offer valuable insights and predictions for the upcoming days.
Trend Analysis:
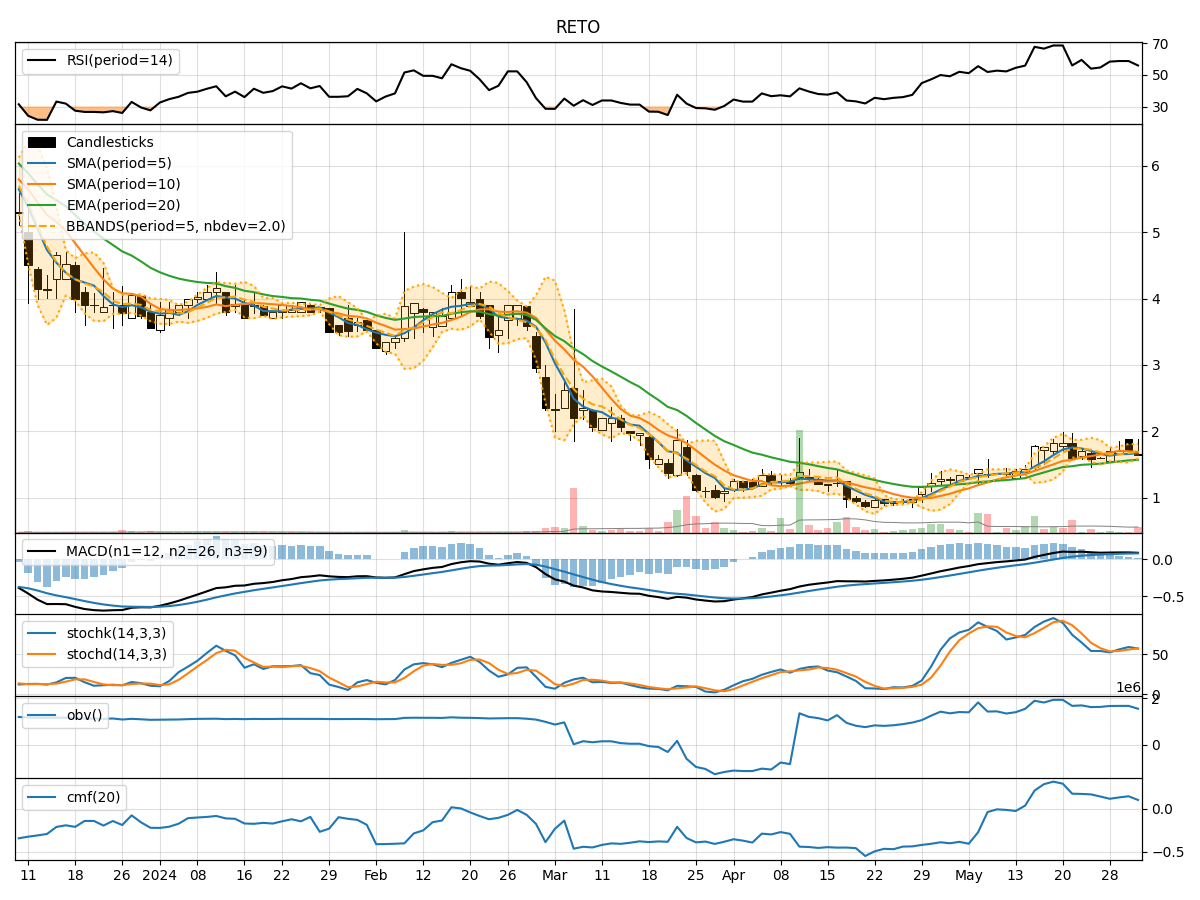
- Moving Averages (MA): The 5-day Moving Average (MA) has been fluctuating around the closing prices, indicating a short-term trend. The Simple Moving Average (SMA) and Exponential Moving Average (EMA) have shown slight variations but have generally followed the price movements.
- MACD: The Moving Average Convergence Divergence (MACD) has been positive, suggesting bullish momentum in the stock price. The MACD Histogram (MACDH) has been decreasing slightly but remains above the signal line, indicating potential consolidation.
Momentum Analysis:
- RSI: The Relative Strength Index (RSI) has been hovering around the mid-level, indicating a balanced momentum between buying and selling pressure.
- Stochastic Oscillator: Both %K and %D lines of the Stochastic Oscillator have shown fluctuations but have not entered overbought or oversold territories, suggesting a neutral momentum.
- Williams %R: The Williams %R has been fluctuating but has not reached extreme levels, indicating a balanced momentum.
Volatility Analysis:
- Bollinger Bands (BB): The Bollinger Bands have shown narrowing bands, suggesting decreasing volatility in the stock price. The price has been trading within the bands, indicating a period of consolidation.
- Bollinger %B: The %B indicator has been fluctuating around the mid-level, reflecting the price's proximity to the bands and the current consolidation phase.
Volume Analysis:
- On-Balance Volume (OBV): The OBV has shown mixed movements, indicating indecision among market participants regarding the stock.
- Chaikin Money Flow (CMF): The CMF has been positive but fluctuating, suggesting some buying pressure in the stock.
Conclusion:
Based on the analysis of the technical indicators, the stock price of RETO is likely to experience sideways movement in the next few days. The trend indicators show a potential consolidation phase, supported by decreasing volatility and neutral momentum. The volume indicators reflect indecision among traders, further supporting the sideways view. Therefore, it is recommended to monitor the price action closely for any potential breakout or trend reversal signals before making any trading decisions.