Technical Analysis of SEPA 2024-05-31
Overview:
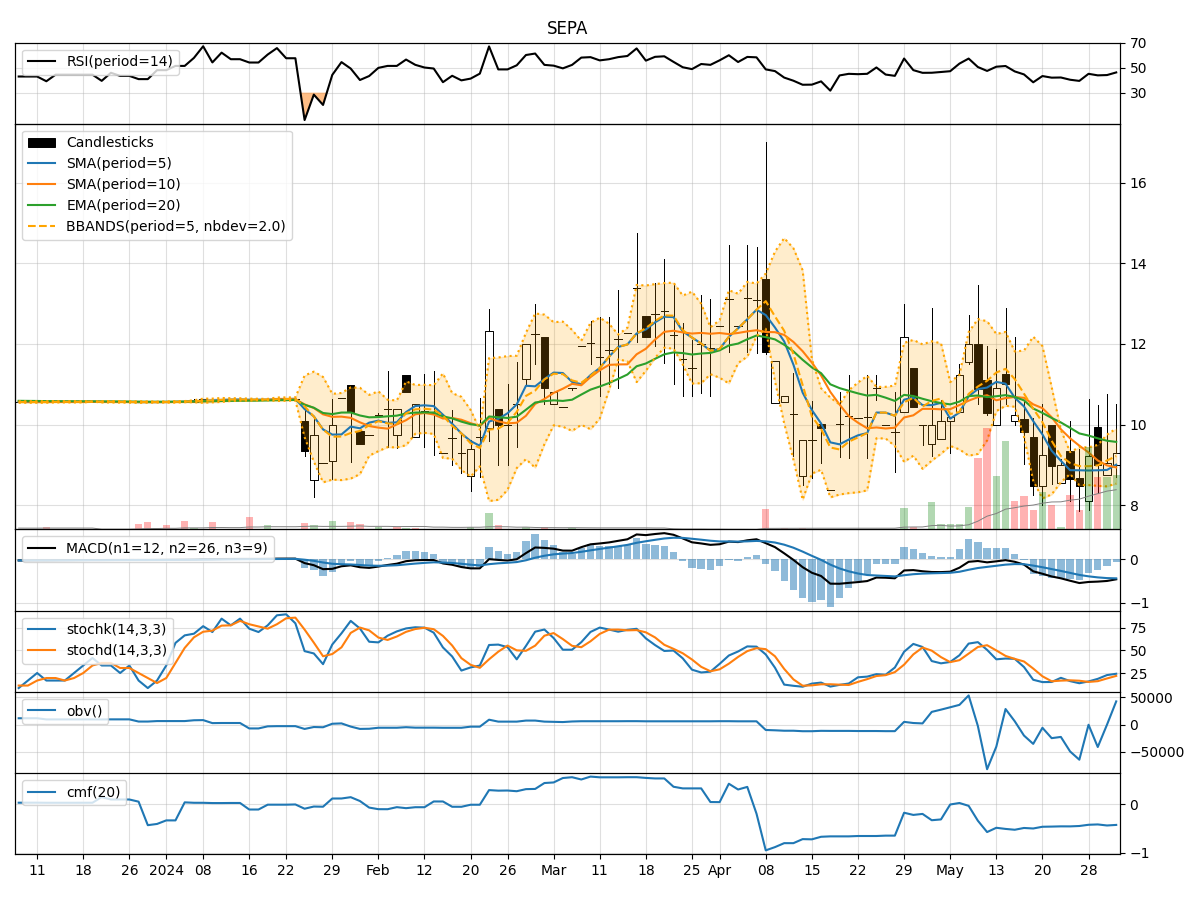
In the last 5 trading days, SEPA stock has shown mixed signals across various technical indicators. The stock price has fluctuated within a certain range, indicating indecision in the market. By analyzing trend, momentum, volatility, and volume indicators, we can gain insights into the potential future price movement of SEPA stock.
Trend Analysis:
- Moving Averages (MA): The 5-day MA has been fluctuating around the actual closing prices, indicating short-term volatility. The SMA(10) and EMA(20) show a downward trend, suggesting a bearish sentiment in the medium to long term.
- MACD: The MACD line has been consistently negative, indicating a bearish trend. The MACD histogram has been decreasing, signaling a weakening bearish momentum.
Momentum Analysis:
- RSI: The RSI has been hovering around the neutral zone, indicating a lack of strong momentum in either direction.
- Stochastic Oscillator: Both %K and %D lines of the Stochastic Oscillator have been gradually increasing, suggesting a potential bullish momentum building up.
- Williams %R: The Williams %R is in the oversold region, indicating a possible reversal in the short term.
Volatility Analysis:
- Bollinger Bands: The stock price has been trading within the Bollinger Bands, suggesting a period of consolidation. The bands are relatively narrow, indicating low volatility.
- Bollinger %B: The %B value is close to 0.5, indicating the stock is trading around the middle band, further confirming the consolidation phase.
Volume Analysis:
- On-Balance Volume (OBV): The OBV has shown mixed signals, with some days experiencing selling pressure and others showing buying interest.
- Chaikin Money Flow (CMF): The CMF has been negative, indicating a lack of buying pressure in the market.
Conclusion:
Based on the analysis of the technical indicators, the next few days for SEPA stock are likely to see sideways movement with a slight bullish bias. The stock is currently in a consolidation phase with low volatility. The momentum indicators suggest a potential bullish momentum building up, supported by the Stochastic Oscillator and Williams %R indicators. However, the trend indicators still show a bearish sentiment in the medium to long term.
Key Points: - Trend: Bearish in the medium to long term. - Momentum: Building bullish momentum in the short term. - Volatility: Low volatility, indicating consolidation. - Volume: Mixed signals, with a lack of strong buying pressure.
Overall View: The stock is likely to trade sideways with a slight bullish bias in the coming days. Traders should closely monitor the momentum indicators for potential entry points and consider the bearish trend for longer-term positions.