Technical Analysis of SGH 2024-05-31
Overview:
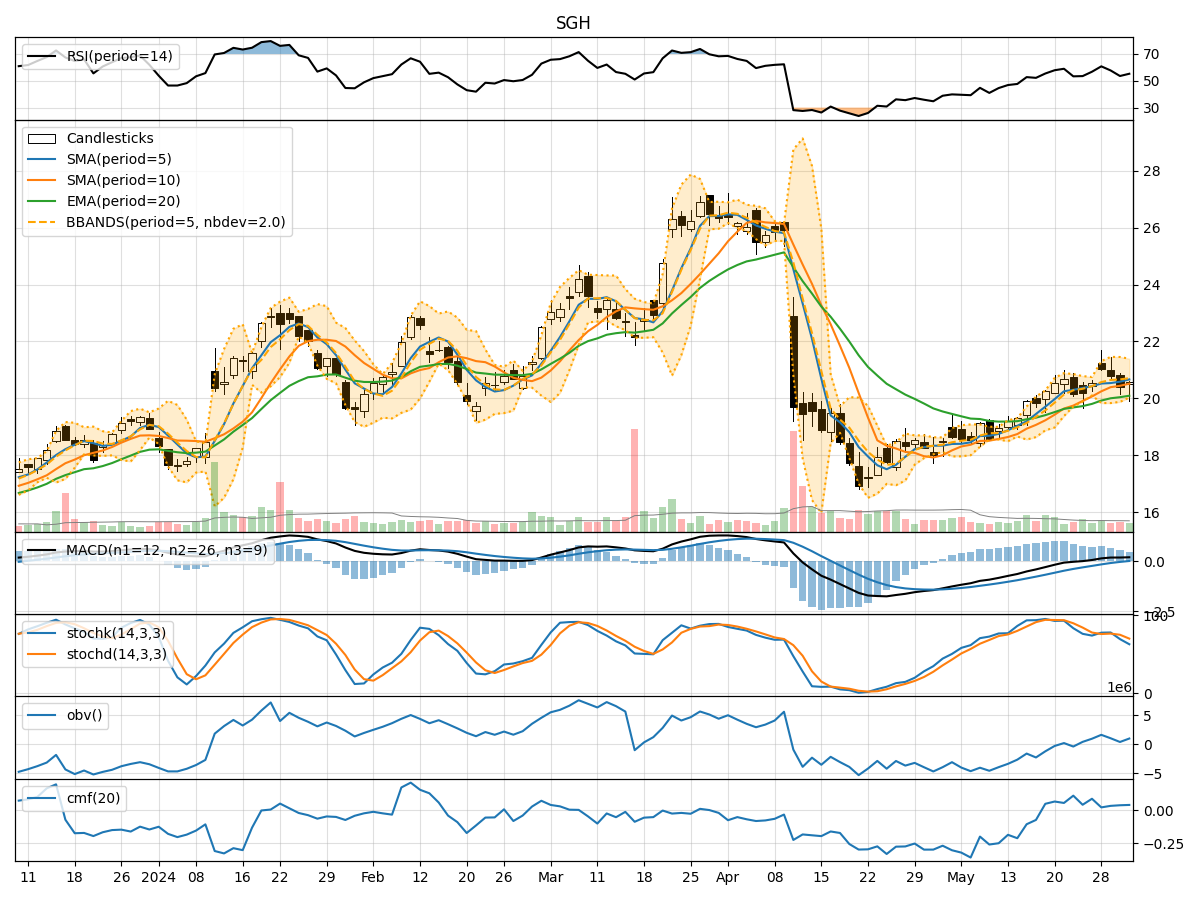
In analyzing the technical indicators for SGH over the last 5 days, we will delve into the trend, momentum, volatility, and volume indicators to provide a comprehensive assessment of the stock's potential price movement. By examining these key factors, we aim to offer valuable insights and predictions for the next few days.
Trend Analysis:
- Moving Averages (MA): The 5-day Moving Average (MA) has been consistently above the Simple Moving Average (SMA) and Exponential Moving Average (EMA), indicating a bullish trend.
- MACD: The MACD line has been consistently above the signal line, suggesting positive momentum in the stock price.
- RSI: The Relative Strength Index (RSI) has been fluctuating around the 50 level, indicating a neutral stance in terms of momentum.
Momentum Analysis:
- Stochastic Oscillator: The Stochastic Oscillator has been gradually decreasing but remains in the overbought territory, signaling a potential reversal or consolidation.
- Williams %R: The Williams %R indicator has been moving towards oversold levels, indicating a possible buying opportunity in the near term.
Volatility Analysis:
- Bollinger Bands: The Bollinger Bands have been narrowing, suggesting a decrease in volatility and a potential period of consolidation.
- Average True Range (ATR): The ATR has been relatively stable, indicating consistent price movement without significant spikes.
Volume Analysis:
- On-Balance Volume (OBV): The OBV has shown mixed signals, with some days experiencing selling pressure and others showing accumulation.
- Chaikin Money Flow (CMF): The CMF has been positive, indicating that money is flowing into the stock despite fluctuations in volume.
Key Observations:
- The stock is currently in a consolidation phase, as indicated by the narrowing Bollinger Bands and stable ATR.
- Momentum indicators suggest a potential reversal or sideways movement in the short term.
- Volume indicators show mixed signals, reflecting uncertainty among market participants.
Conclusion:
Based on the analysis of the technical indicators, the next few days for SGH are likely to see sideways movement with a slight bias towards consolidation. Traders should exercise caution and wait for clearer signals before making significant trading decisions. It is advisable to monitor key levels such as support and resistance for potential breakout opportunities.