Technical Analysis of TWLV 2024-05-31
Overview:
In analyzing the technical indicators for TWLV over the last 5 days, we will delve into the trend, momentum, volatility, and volume indicators to provide a comprehensive outlook on the possible stock price movement in the coming days. By examining these key indicators, we aim to offer valuable insights and predictions for potential investors.
Trend Indicators:
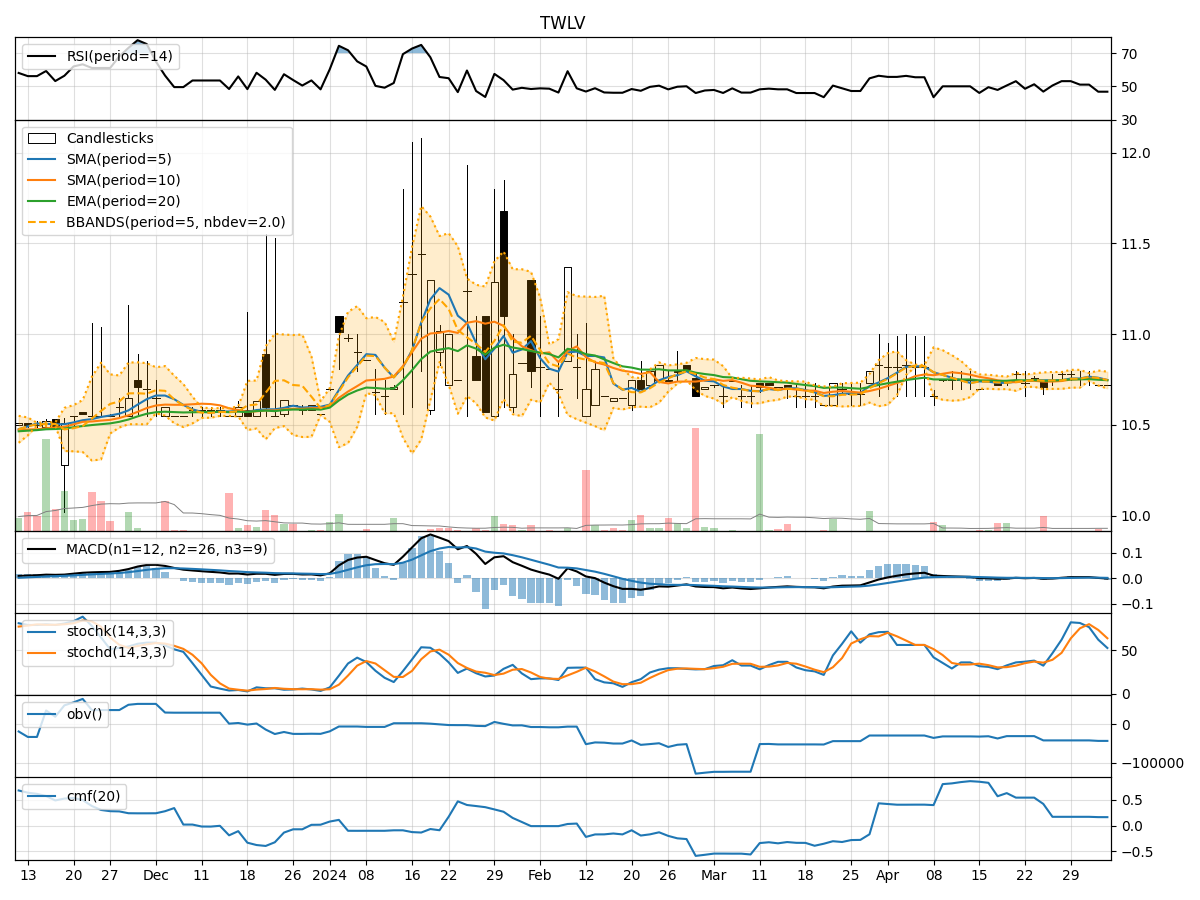
- Moving Averages (MA): The 5-day MA has been fluctuating around the closing prices, indicating short-term price trends. The Simple Moving Average (SMA) and Exponential Moving Average (EMA) show a slight uptrend, with the EMA indicating a more recent positive momentum.
- MACD: The Moving Average Convergence Divergence (MACD) and its signal line (MACDH) have been increasing, suggesting a bullish momentum in the stock price.
Momentum Indicators:
- RSI: The Relative Strength Index (RSI) has been increasing, indicating strengthening bullish momentum.
- Stochastic Oscillator: Both %K and %D lines of the Stochastic Oscillator have been rising, signaling a bullish sentiment.
- Williams %R: The Williams %R is in the oversold region, suggesting a potential reversal in the stock price.
Volatility Indicators:
- Bollinger Bands (BB): The Bollinger Bands have widened, indicating increased volatility in the stock price. The current price is near the upper band, suggesting a potential overbought condition.
Volume Indicators:
- On-Balance Volume (OBV): The OBV has been relatively stable, indicating a balance between buying and selling pressure.
- Chaikin Money Flow (CMF): The CMF has been negative, suggesting a bearish money flow in the stock.
Key Observations and Opinions:
- Trend: The trend indicators show a bullish bias with increasing moving averages and MACD, indicating a potential upward movement in the stock price.
- Momentum: Momentum indicators like RSI and Stochastic Oscillator suggest a bullish sentiment, supported by the oversold condition in Williams %R.
- Volatility: The widening Bollinger Bands indicate increased volatility, potentially leading to sharp price movements.
- Volume: The stable OBV and negative CMF imply a neutral to bearish volume sentiment in the stock.
Conclusion:
Based on the analysis of the technical indicators, the next few days' possible stock price movement for TWLV is likely to be upward. The bullish trend and momentum indicators, coupled with increased volatility, suggest a potential price increase in the coming days. However, investors should closely monitor the price action near the upper Bollinger Band for potential overbought conditions. Overall, the outlook for TWLV appears positive, with a higher probability of upward movement in the near term.