Technical Analysis of VIRI 2024-05-31
Overview:
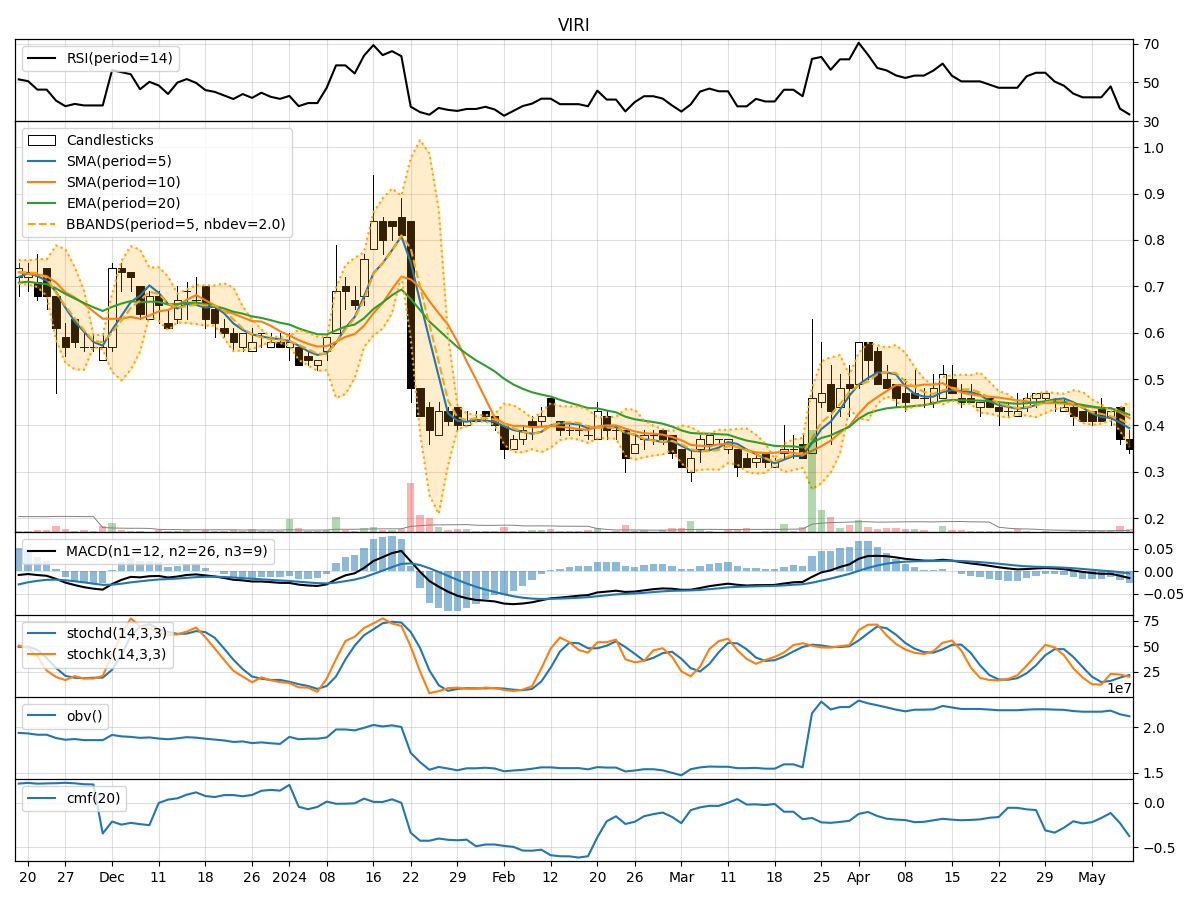
In analyzing the technical indicators for VIRI stock over the last 5 days, we will delve into the trends, momentum, volatility, and volume aspects to provide a comprehensive outlook on the possible stock price movement in the coming days. By examining key indicators such as moving averages, MACD, RSI, Bollinger Bands, and OBV, we aim to offer valuable insights and predictions for informed decision-making.
Trend Analysis:
- Moving Averages (MA): The 5-day MA has been consistently below the closing prices, indicating a downward trend.
- MACD: The MACD line has been negative, suggesting bearish momentum in the stock.
- EMA: The EMA values have been declining, further supporting the bearish trend.
Momentum Analysis:
- RSI: The RSI values have been relatively low, indicating oversold conditions in the stock.
- Stochastic Oscillator: Both %K and %D values have been trending downwards, signaling weakening momentum.
- Williams %R: The indicator has been consistently in the oversold territory, reflecting bearish sentiment.
Volatility Analysis:
- Bollinger Bands: The bands have been narrowing, suggesting decreasing volatility in the stock.
- Bollinger %B: The %B values have been fluctuating but generally indicate a lack of strong trend.
Volume Analysis:
- On-Balance Volume (OBV): The OBV values have been mixed, showing no clear accumulation or distribution pattern.
- Chaikin Money Flow (CMF): The CMF values have been relatively stable, indicating neutral money flow in the stock.
Key Observations:
- The stock is currently in a downtrend based on moving averages and MACD.
- Momentum indicators like RSI and Stochastic Oscillator suggest oversold conditions.
- Volatility has been decreasing, as indicated by the narrowing Bollinger Bands.
- Volume indicators show mixed signals with no clear accumulation or distribution pattern.
Conclusion:
Based on the analysis of technical indicators, the next few days for VIRI stock are likely to see further downside movement. The stock is currently in a bearish phase, with momentum indicators pointing towards oversold conditions. Volatility is decreasing, indicating a lack of significant price movements, while volume indicators do not provide a clear direction. Therefore, it is advisable to exercise caution and consider potential short-term bearish positions or wait for more definitive signals before making any trading decisions.