Technical Analysis of MODN 2024-05-31
Overview:
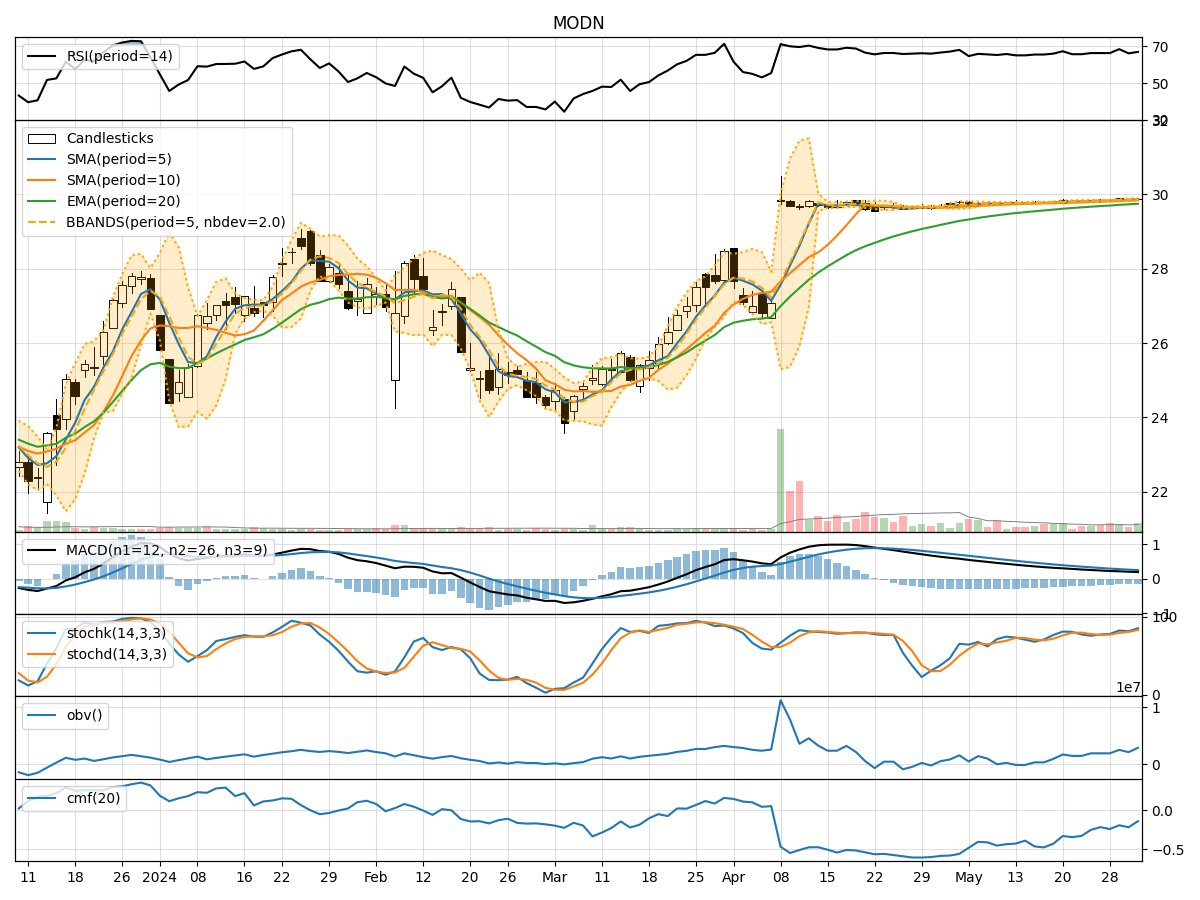
In analyzing the technical indicators for MODN over the last 5 days, we will delve into the trend, momentum, volatility, and volume indicators to provide a comprehensive outlook on the possible stock price movement in the coming days. By examining these key indicators, we aim to offer valuable insights and predictions for potential investors.
Trend Analysis:
- Moving Averages (MA): The 5-day MA has been relatively stable around the closing price, indicating a neutral trend.
- MACD: The MACD line has been consistently positive, suggesting a bullish trend.
- EMA: The EMA has been gradually increasing, reflecting a positive trend.
Key Observation: The trend indicators point towards a bullish sentiment in the stock price movement.
Momentum Analysis:
- RSI: The RSI values have been fluctuating around the overbought territory, indicating strong buying momentum.
- Stochastic Oscillator: Both %K and %D have been in the overbought zone, signaling a strong bullish momentum.
- Williams %R: The indicator has been hovering in the oversold region, suggesting a potential reversal.
Key Observation: Momentum indicators suggest a strong bullish sentiment in the stock price momentum.
Volatility Analysis:
- Bollinger Bands (BB): The bands have been relatively narrow, indicating low volatility.
- Bollinger %B: The %B values have been fluctuating within a tight range, reflecting stable volatility.
Key Observation: Volatility indicators point towards low volatility in the stock price movement.
Volume Analysis:
- On-Balance Volume (OBV): The OBV values have shown mixed trends, indicating indecision among investors.
- Chaikin Money Flow (CMF): The CMF values have been negative, suggesting a bearish money flow.
Key Observation: Volume indicators reflect mixed signals with a slight bearish bias.
Conclusion:
Based on the analysis of trend, momentum, volatility, and volume indicators, the overall outlook for MODN suggests a bullish sentiment in the short term. The strong positive trend indicated by the MACD and EMA, coupled with the robust buying momentum highlighted by RSI and Stochastic Oscillator, support the potential for further price appreciation.
However, the mixed signals from volume indicators and the presence of low volatility as indicated by Bollinger Bands suggest a degree of caution. Investors should closely monitor the stock for any signs of reversal or consolidation.
In conclusion, the next few days are likely to see a continuation of the upward** trend in MODN's stock price, driven by strong momentum and positive trend indicators. Investors should consider capitalizing on potential buying opportunities while remaining vigilant for any shifts in market dynamics.