Technical Analysis of NGVT 2024-05-31
Overview:
In analyzing the technical indicators for NGVT over the last 5 days, we will delve into the trend, momentum, volatility, and volume indicators to provide a comprehensive assessment of the stock's potential price movement. By examining these key factors, we aim to offer valuable insights and predictions for the next few days.
Trend Analysis:
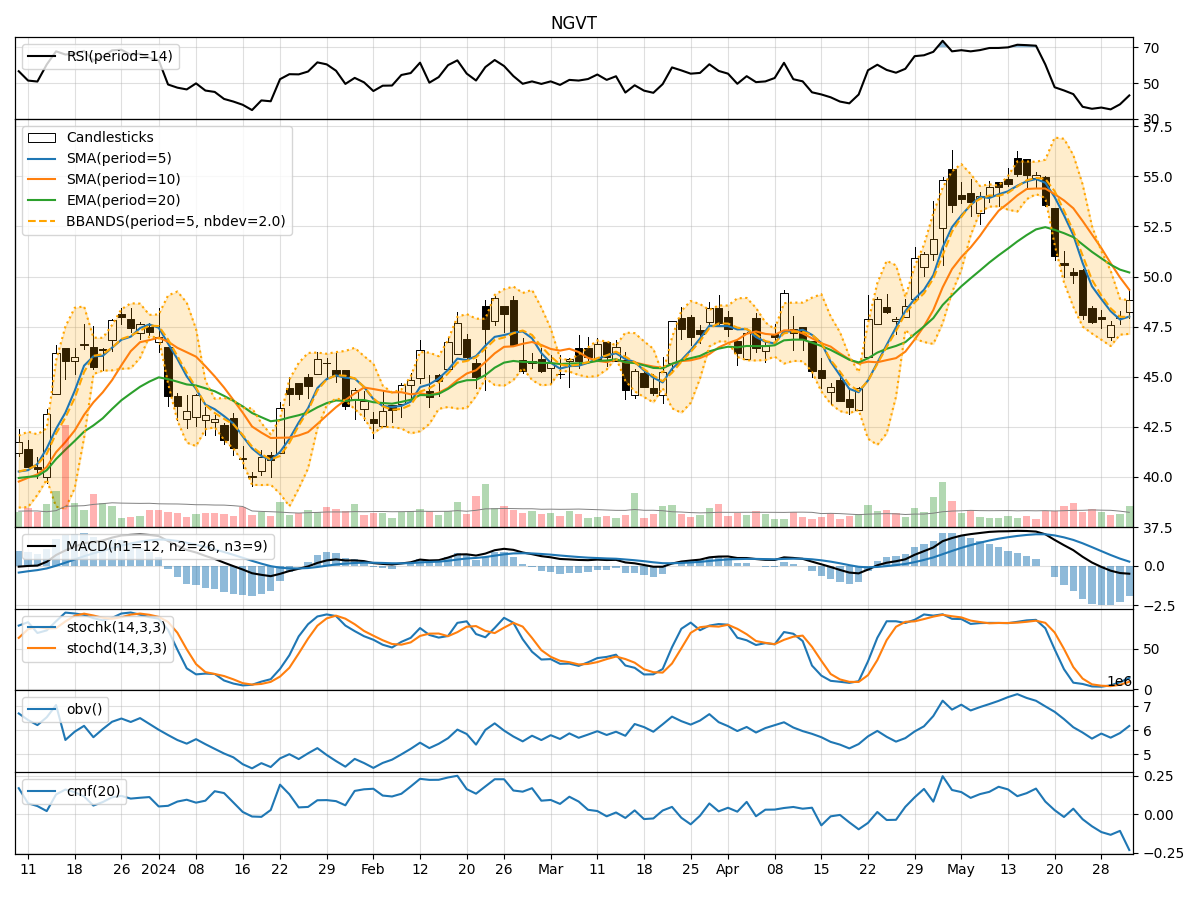
- Moving Averages (MA): The 5-day MA has been consistently below the closing prices, indicating a short-term downtrend.
- MACD: The MACD line has been decreasing, with the MACD histogram showing negative values, suggesting a bearish momentum.
- EMA: The EMA has been declining, further supporting the bearish trend.
Key Observation: The trend indicators point towards a bearish outlook for NGVT.
Momentum Analysis:
- RSI: The RSI has been relatively low, indicating oversold conditions but not yet showing signs of a reversal.
- Stochastic Oscillator: Both %K and %D have been decreasing, signaling weakening momentum.
- Williams %R: The indicator has been in the oversold territory, suggesting a potential bounce but not a clear reversal.
Key Observation: Momentum indicators reflect a bearish sentiment with some signs of potential reversal.
Volatility Analysis:
- Bollinger Bands (BB): The stock price has been trading below the middle Bollinger Band, indicating a downtrend.
- Bollinger Band Width: The band width has been narrowing, suggesting decreasing volatility.
- Bollinger Band %B: The %B indicator has been below 1, indicating the price is below the lower band.
Key Observation: Volatility indicators signal a bearish trend with decreasing volatility.
Volume Analysis:
- On-Balance Volume (OBV): The OBV has been fluctuating but not showing a clear trend, indicating mixed buying and selling pressure.
- Chaikin Money Flow (CMF): The CMF has been negative, suggesting outflow of money from the stock.
Key Observation: Volume indicators suggest a neutral stance with no clear direction.
Conclusion:
Based on the analysis of trend, momentum, volatility, and volume indicators, the overall outlook for NGVT in the next few days is bearish. The stock is likely to continue its downward trend with some potential for a short-term bounce due to oversold conditions in momentum indicators. However, the lack of strong buying pressure and the prevailing bearish trend indicate that any upside may be limited.
Key Conclusion: The next few days are likely to see further downward movement in NGVT's stock price. Investors should exercise caution and consider waiting for more definitive signals of a trend reversal before considering long positions.